A gg-matrix is a twodimensional
object which contents are coincident data from an experiment. To
examine coincident data you can cut out a slice of the matrix
which gives you a cut spectrum. To actually create a cut
spectrum (see chapter 5 p. ![]() ) you must
define a cut gate using the hotkey c. Similar to the
definition of the fit-region you define the left and right border of
the cut gate by pressing c once for each border. Further gates
defined with c are automatically interpreted as
background gates. If you want additional cut gates, use the
hotkey GG to define them. Pressing C performs the
cut and the cut-spectrum will be displayed in the window. You can
delete your cut and background gates by pressing -C.
) you must
define a cut gate using the hotkey c. Similar to the
definition of the fit-region you define the left and right border of
the cut gate by pressing c once for each border. Further gates
defined with c are automatically interpreted as
background gates. If you want additional cut gates, use the
hotkey GG to define them. Pressing C performs the
cut and the cut-spectrum will be displayed in the window. You can
delete your cut and background gates by pressing -C.
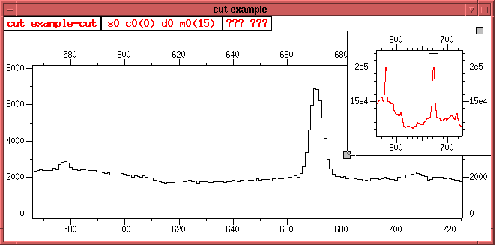
A gate will then be marked in your projection as shown in figure
2.4 on page ![]() .
.
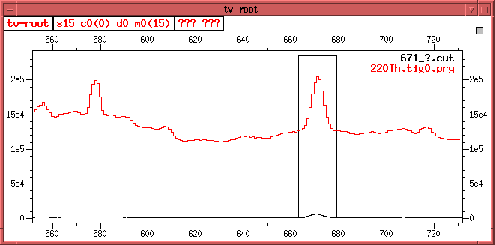 |
With a view to greater clarity it is recommended to create the so called cut-window. It displays the projection and cut in one window. You can create it with the command:
tv window create cut testcut
Compare figure 2.4 on page
![]() and figure 2.5 on page
and figure 2.5 on page
![]() to see the advantages of the cut-window.
to see the advantages of the cut-window.